South Bay Service Planning Area (SPA) 8
Homeless Count 2018 Results
Homeless Count 2018 Results
|
Under the leadership of the Los Angeles Homeless Services Authority (LAHSA) and the South Bay Coalition to End Homelessness, the entire region consisting of over 4,000 road miles was canvassed with the help of over 550 volunteers. This is the fourth time 100% of SPA 8 was covered, providing an exceptionally detailed view of homelessness throughout the South Bay, along with recent trends.
We wish to thank the South Bay municipalities, local law enforcement, Coordinated Entry System outreach teams, City of Los Angeles neighborhood councils, hospitals, faith community, and community volunteers for making the 2018 Count a success. We also want to extend a special thanks to LAHSA for working in partnership with our coalition and making detailed Homeless Count data available for us to use as the basis for the reports on this webpage. |
For the night of January 23, 2018, 4,138 people were identified as experiencing homelessness in the SPA 8/South Bay.
Homeless Count 2018 SPA 8 Overview
This data sheet contains: Homelessness demographic information for SPA 8/South Bay in the Los Angeles Continuum of Care (i.e., LA County minus Long Beach, Glendale, and Pasadena)
Notable Demographic Decreases in the South Bay Between 2017 and 2018
|
SPA-Wide Reports
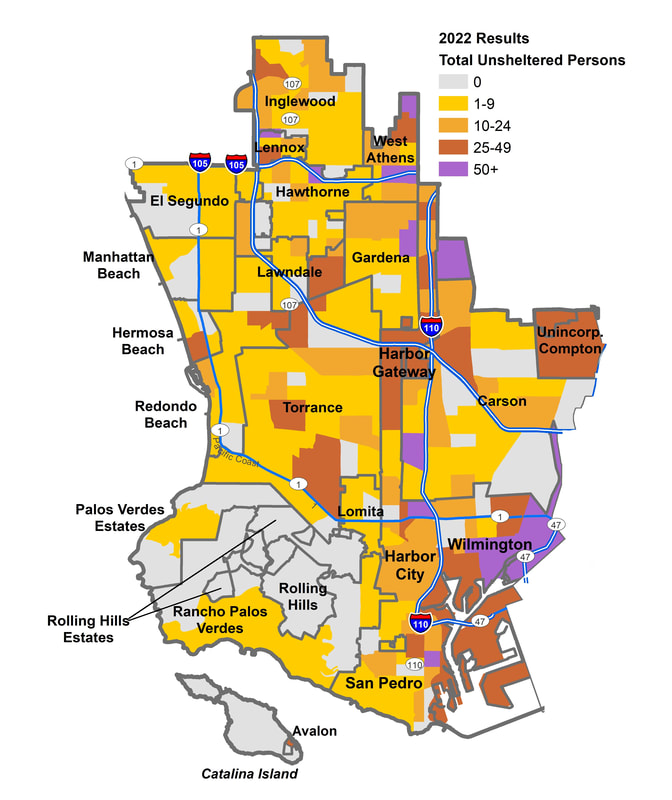
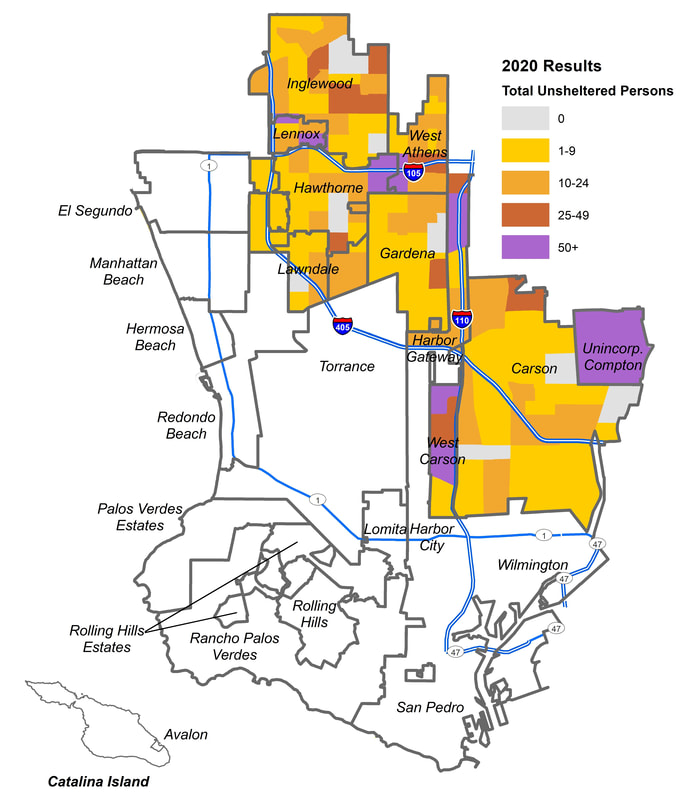
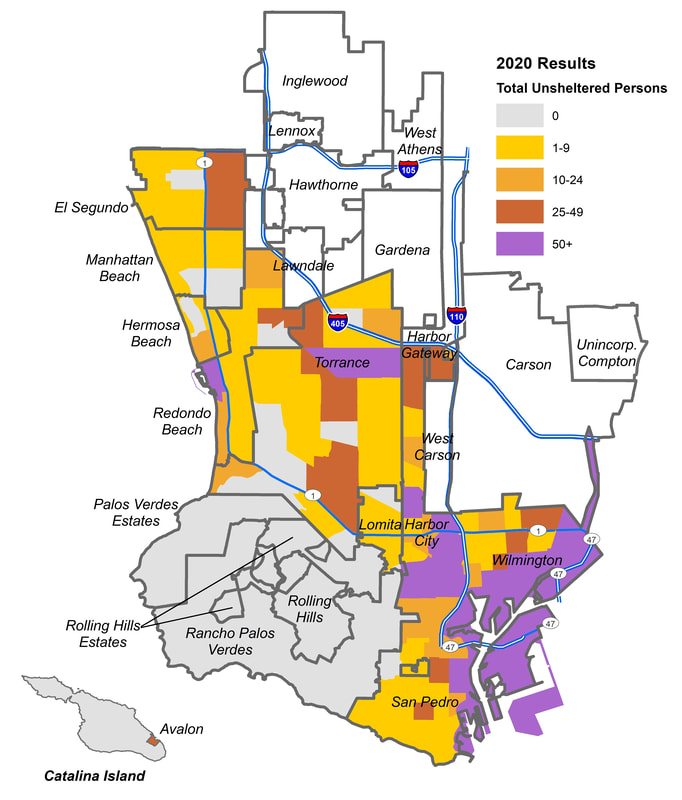
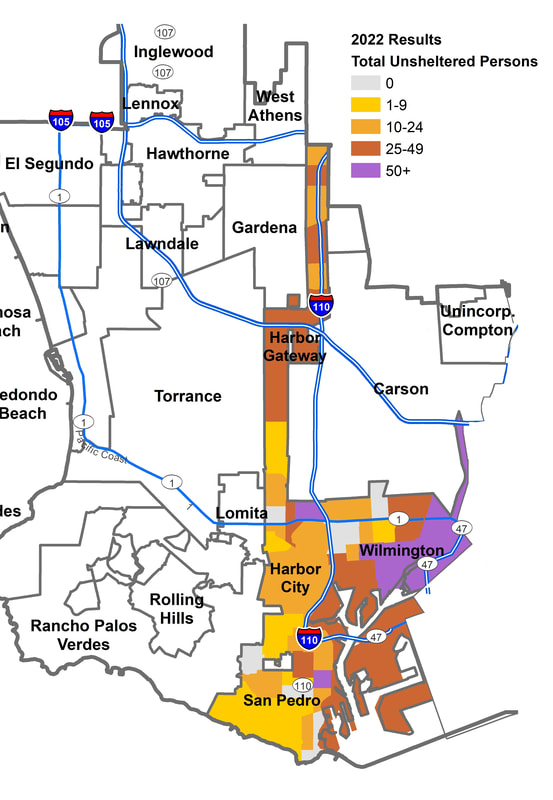
Click on the jurisdictional map to see the 2018 report.
Click on the jurisdictional map to see the 2018 report.
|
Los Angeles County
Supervisorial District 2 within SPA 8 |
Los Angeles County
Supervisorial District 4 within SPA 8 |
City of Los Angeles
Council District 15 within SPA 8 Additionally, this data sheet presents the trends from 2016-2018 for the entire
Council District (SPAs 6 & 8) |
2,183 Persons Homeless 1,792 Persons Homeless 1,306 Persons Homeless
7% increase 8% decrease 8% decrease
7% increase 8% decrease 8% decrease
City or Neighborhood Reports
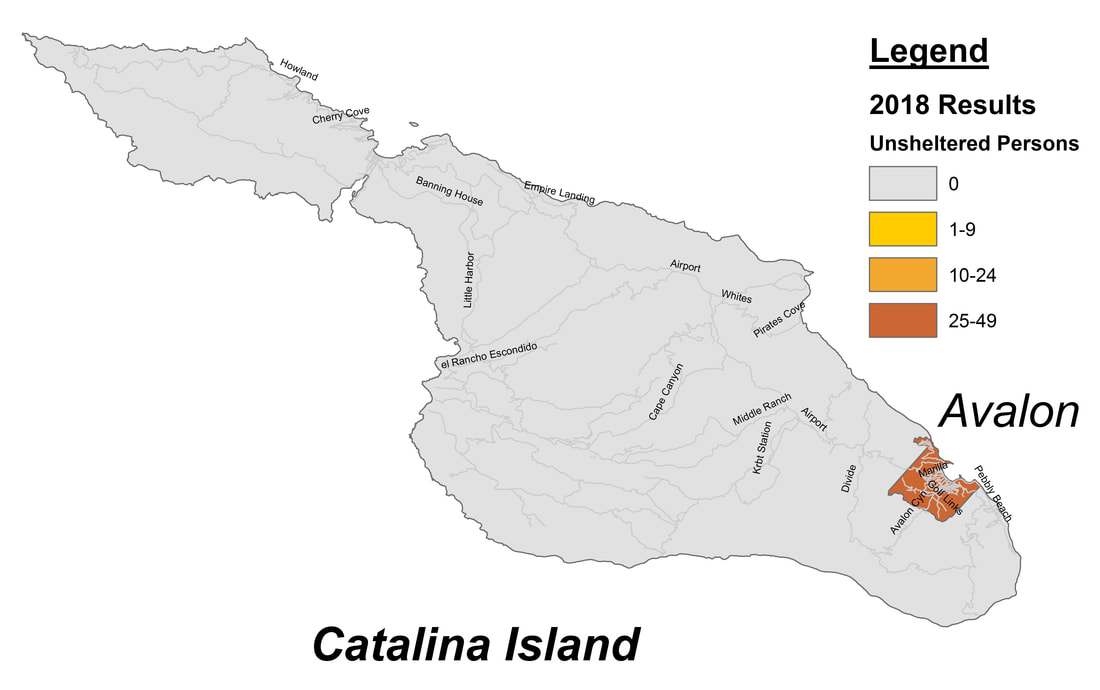
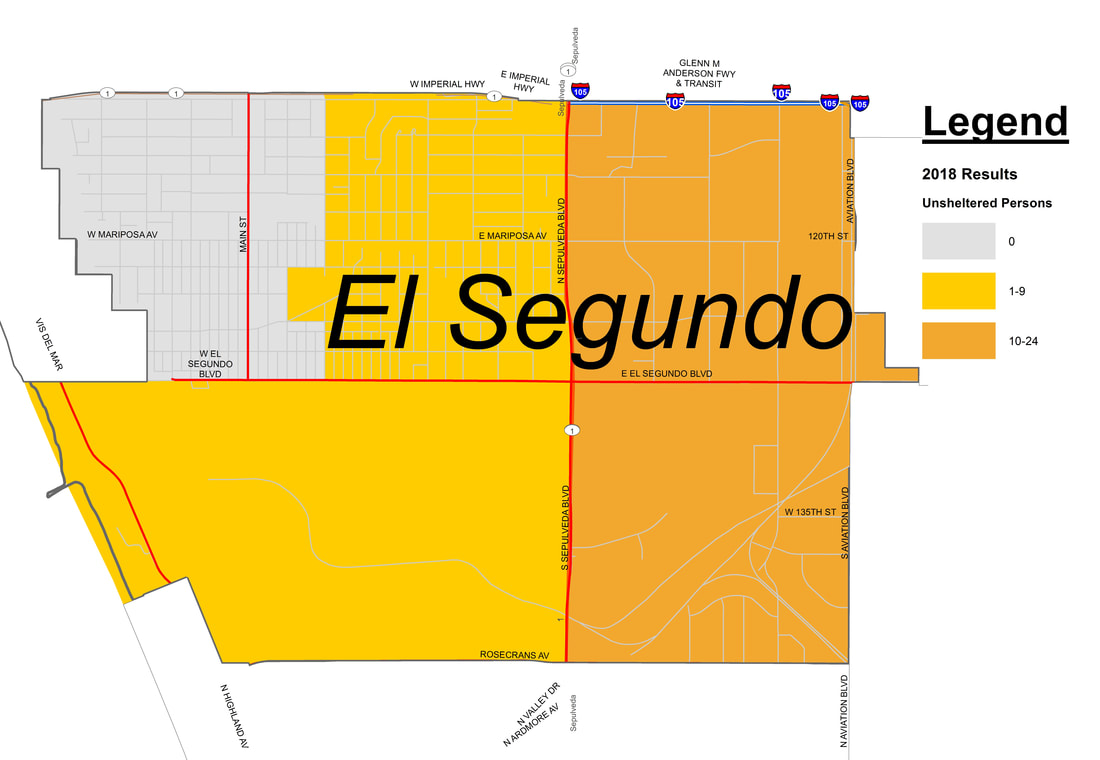
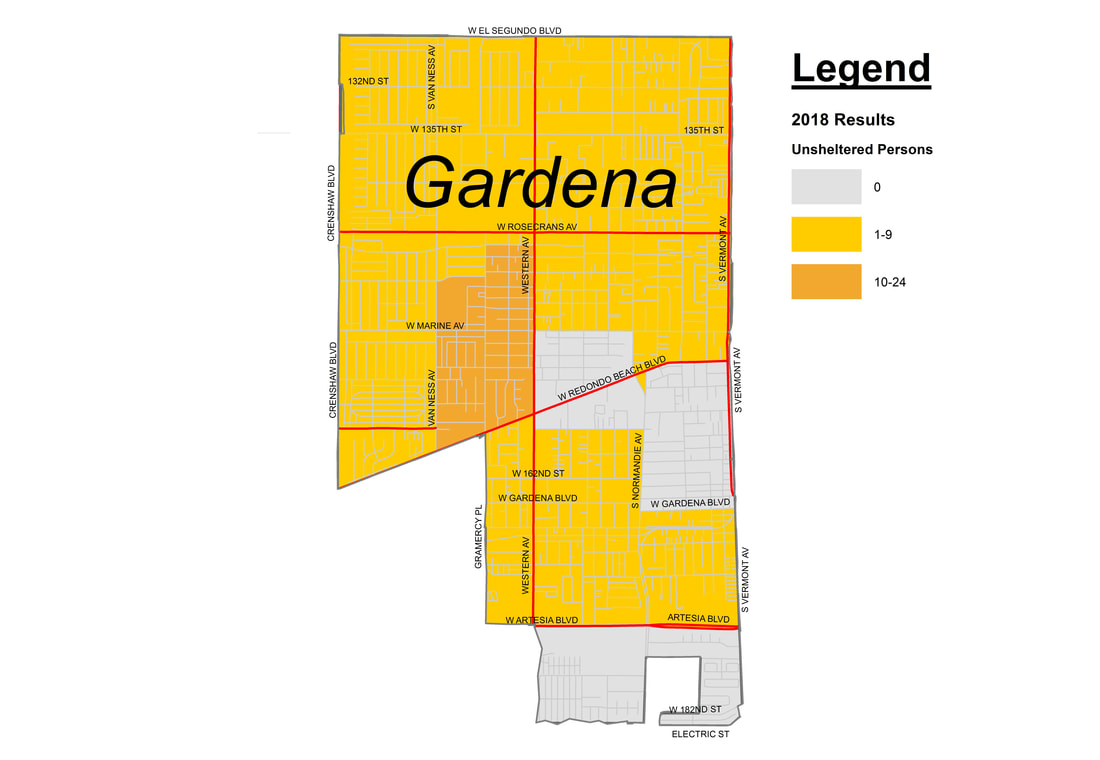
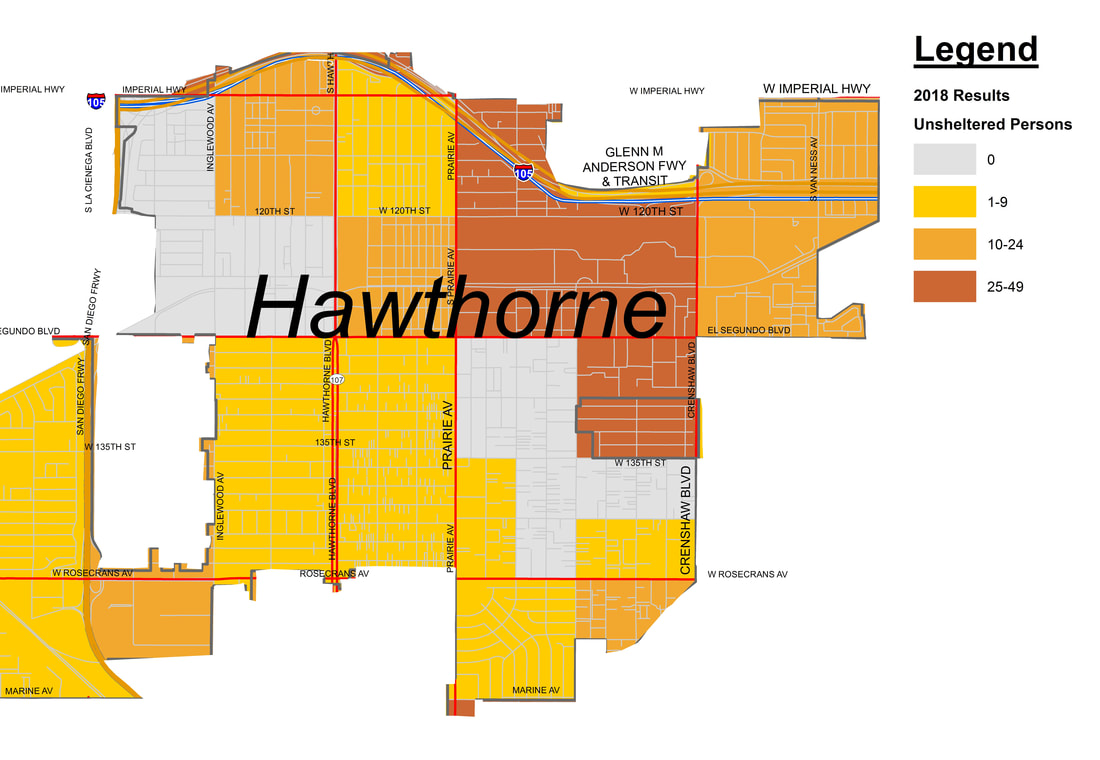
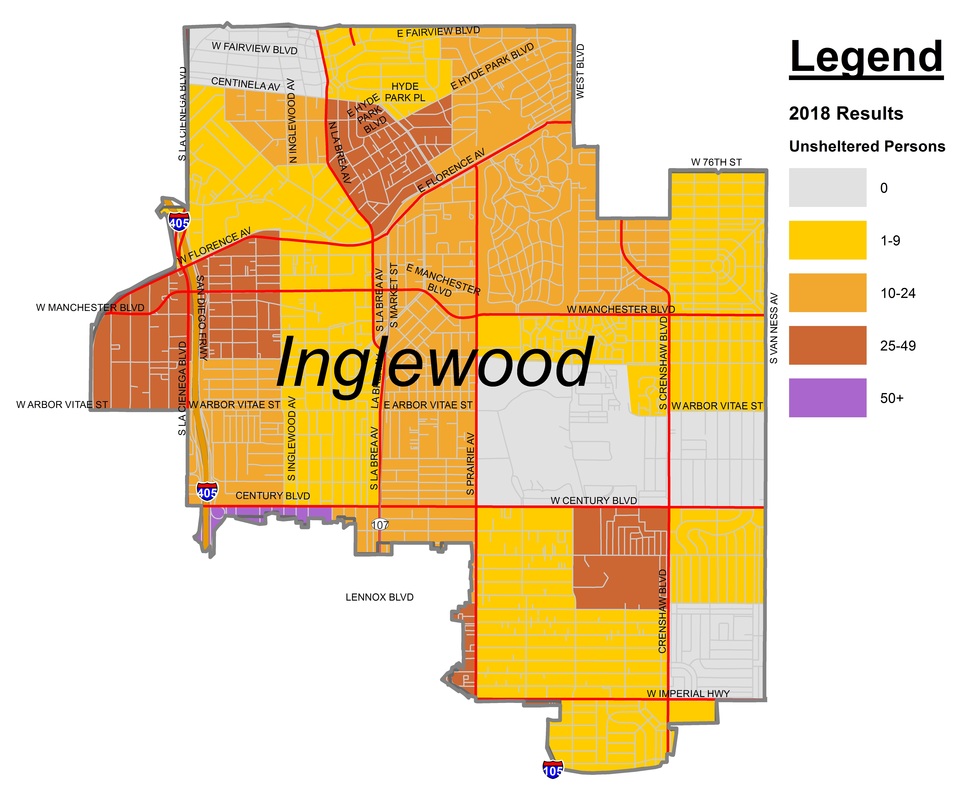
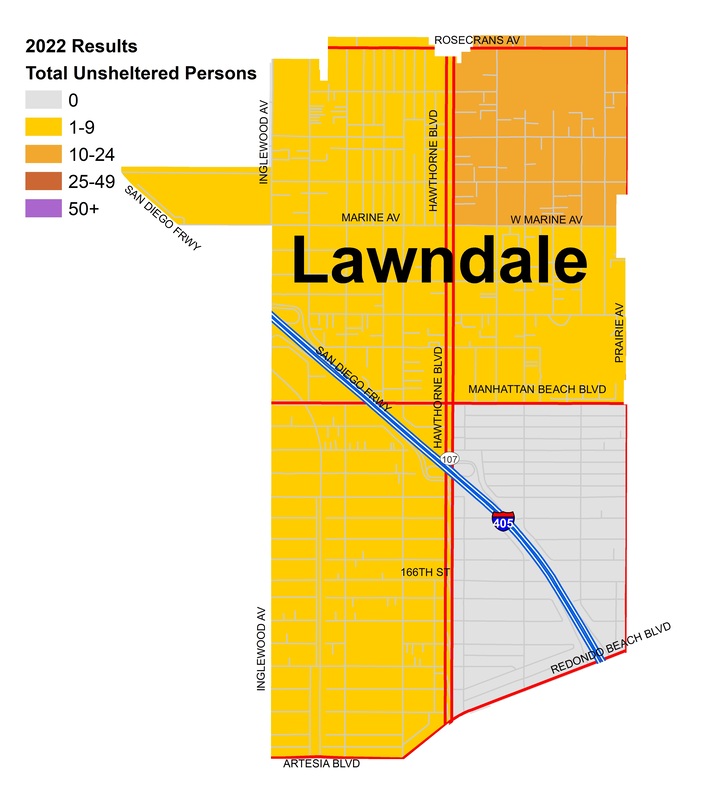
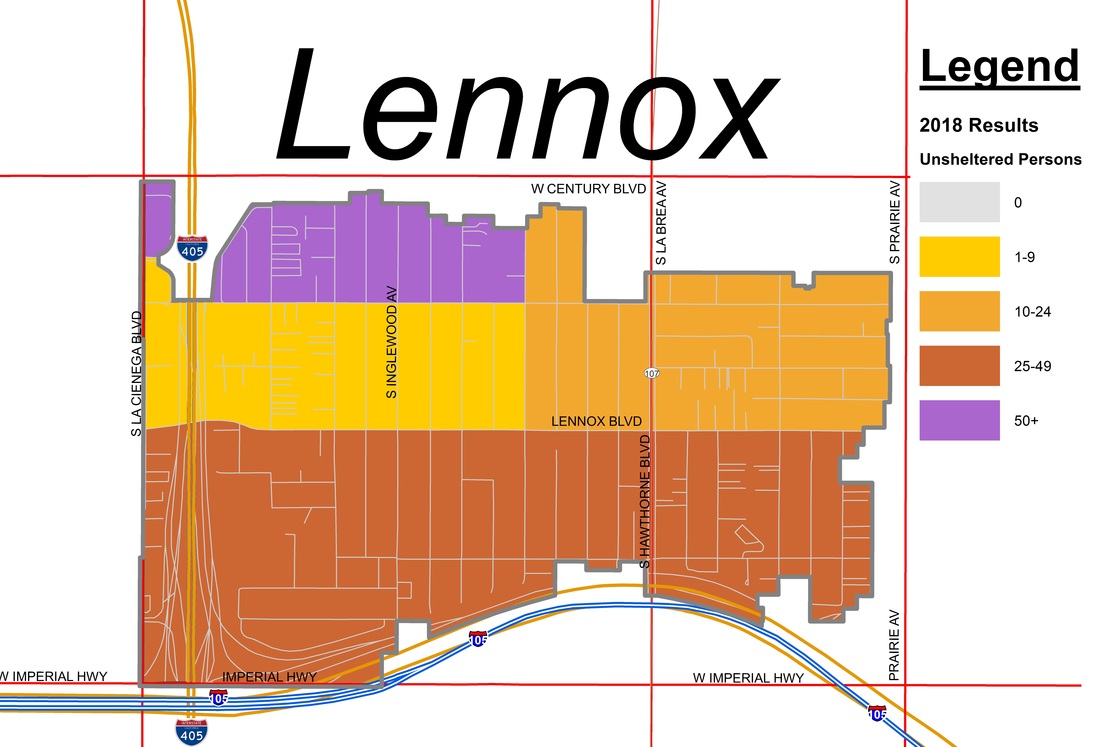
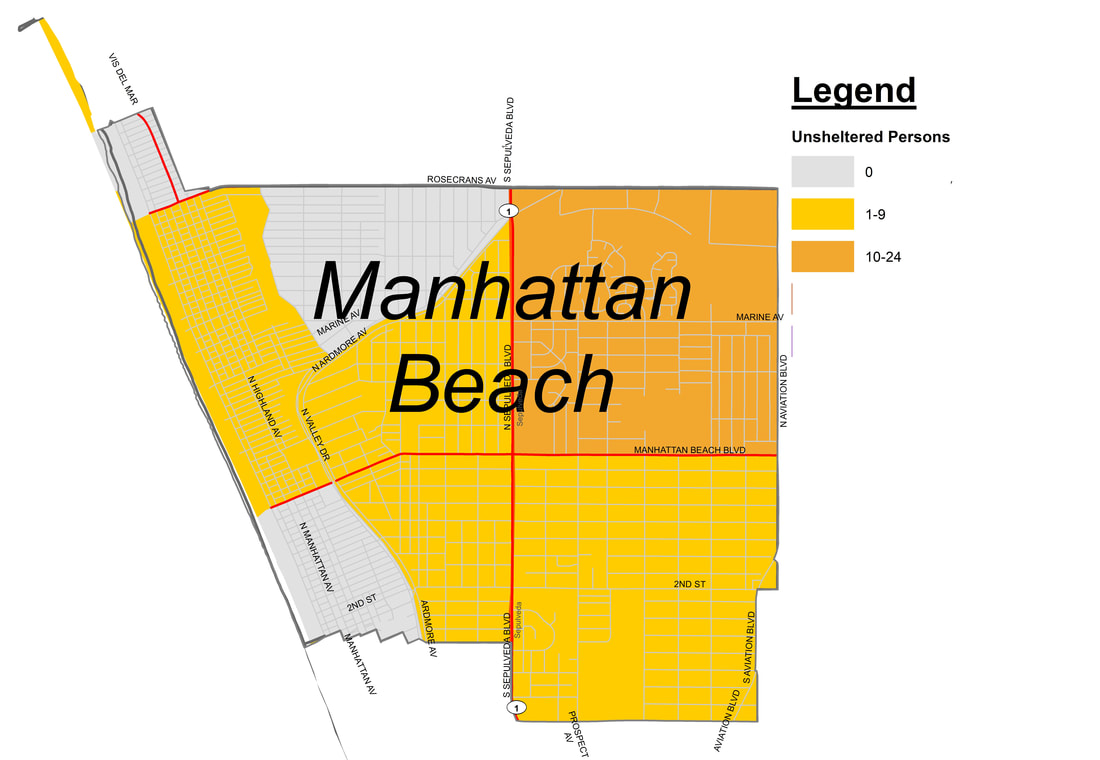
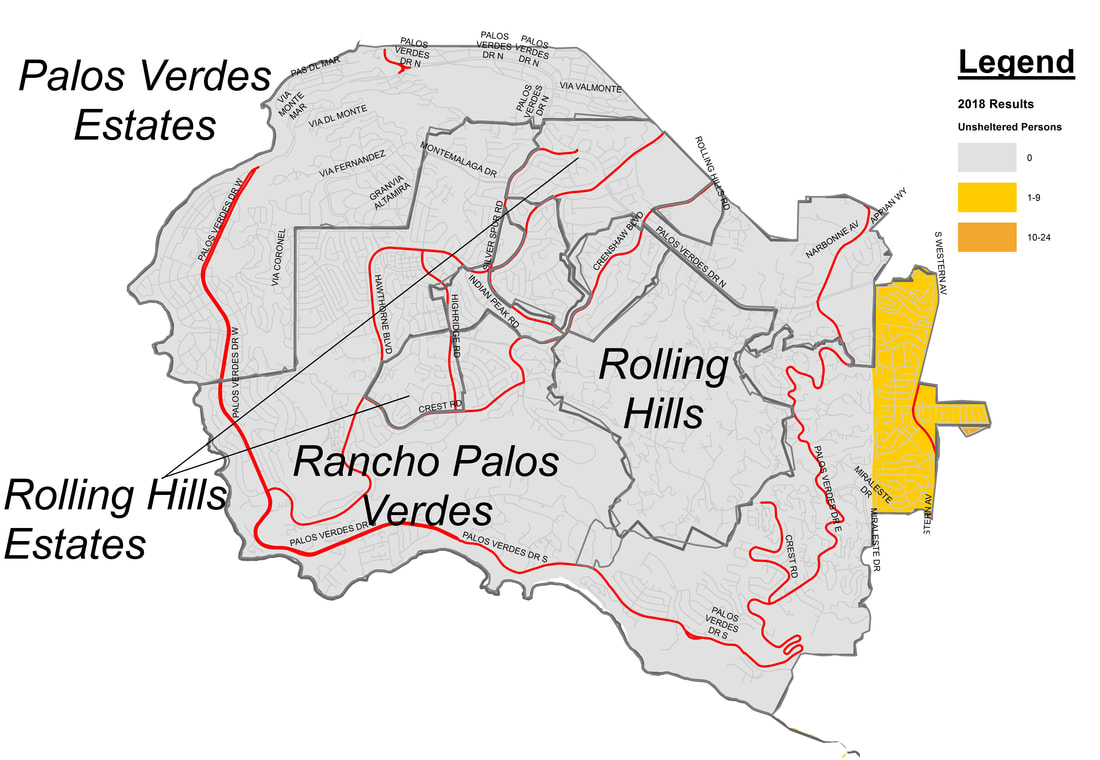
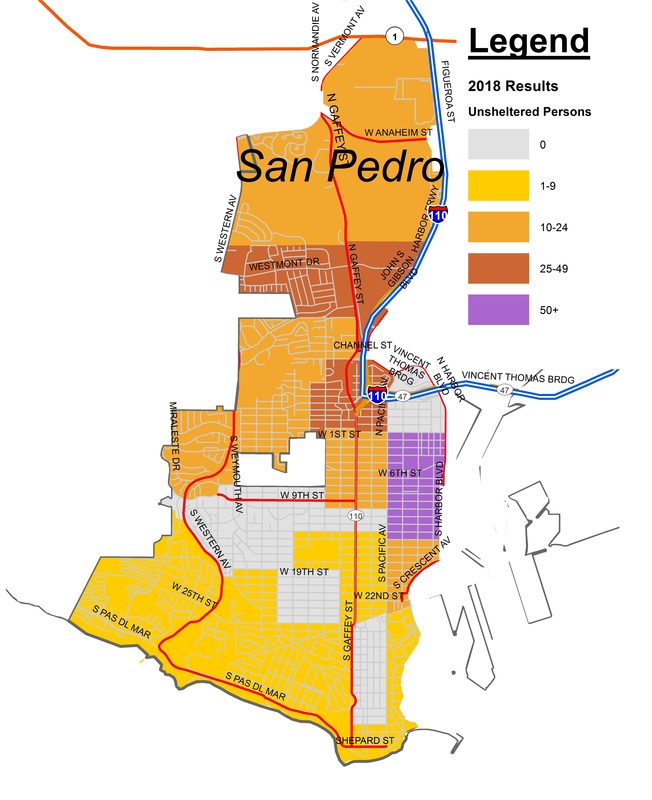
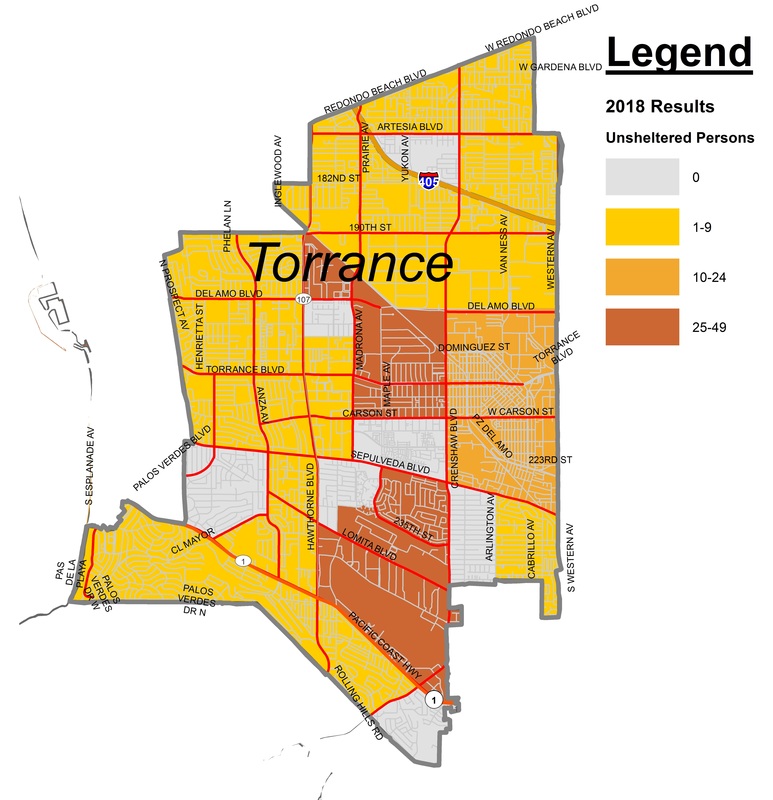
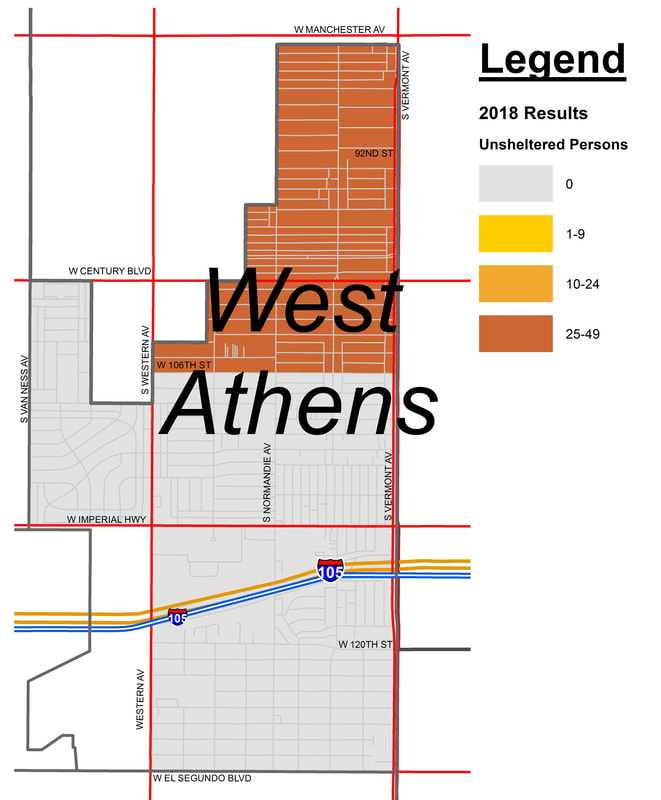
Click on the City/Neighborhood map to see the 2018 city-level report.
Click on the City/Neighborhood map to see the 2018 city-level report.
462 Persons Homeless 43 Persons Homeless 15 Persons Homeless 47 Persons Homeless 104 Persons Homeless
22% increase 223% increase 40% decrease 80% decrease 5% decrease
22% increase 223% increase 40% decrease 80% decrease 5% decrease
167 Persons Homeless 138 Persons Homeless 23 Persons Homeless 505 Persons Homeless 31 Persons Homeless
17% decrease 86% increase 21% increase 51% increase 26% decrease
17% decrease 86% increase 21% increase 51% increase 26% decrease
175 Persons Homeless 14 Persons Homeless 41 Persons Homeless 4 Persons Homeless 154 Persons Homeless
22% increase 55% decrease 486% increase 100% increase 41% decrease
22% increase 55% decrease 486% increase 100% increase 41% decrease
497 Persons Homeless 188 Persons Homeless 109 Persons Homeless 200 Persons Homeless 538 Persons Homeless
3% decrease 29% increase 37% decrease 60% increase 10% decrease
3% decrease 29% increase 37% decrease 60% increase 10% decrease
City of Long Beach
Long Beach is part of Los Angeles County's SPA 8 but is its own "continuum of care," thus it conducts a separate homeless count for its jurisdiction every other year. The following links provide more information about its work.
2017 Homeless Count Results (shows comparisons from the 2011, 2013, and 2015 Counts)
Multi-Service Center (MSC) Information
Long Beach's Homeless Services General Information

